Description
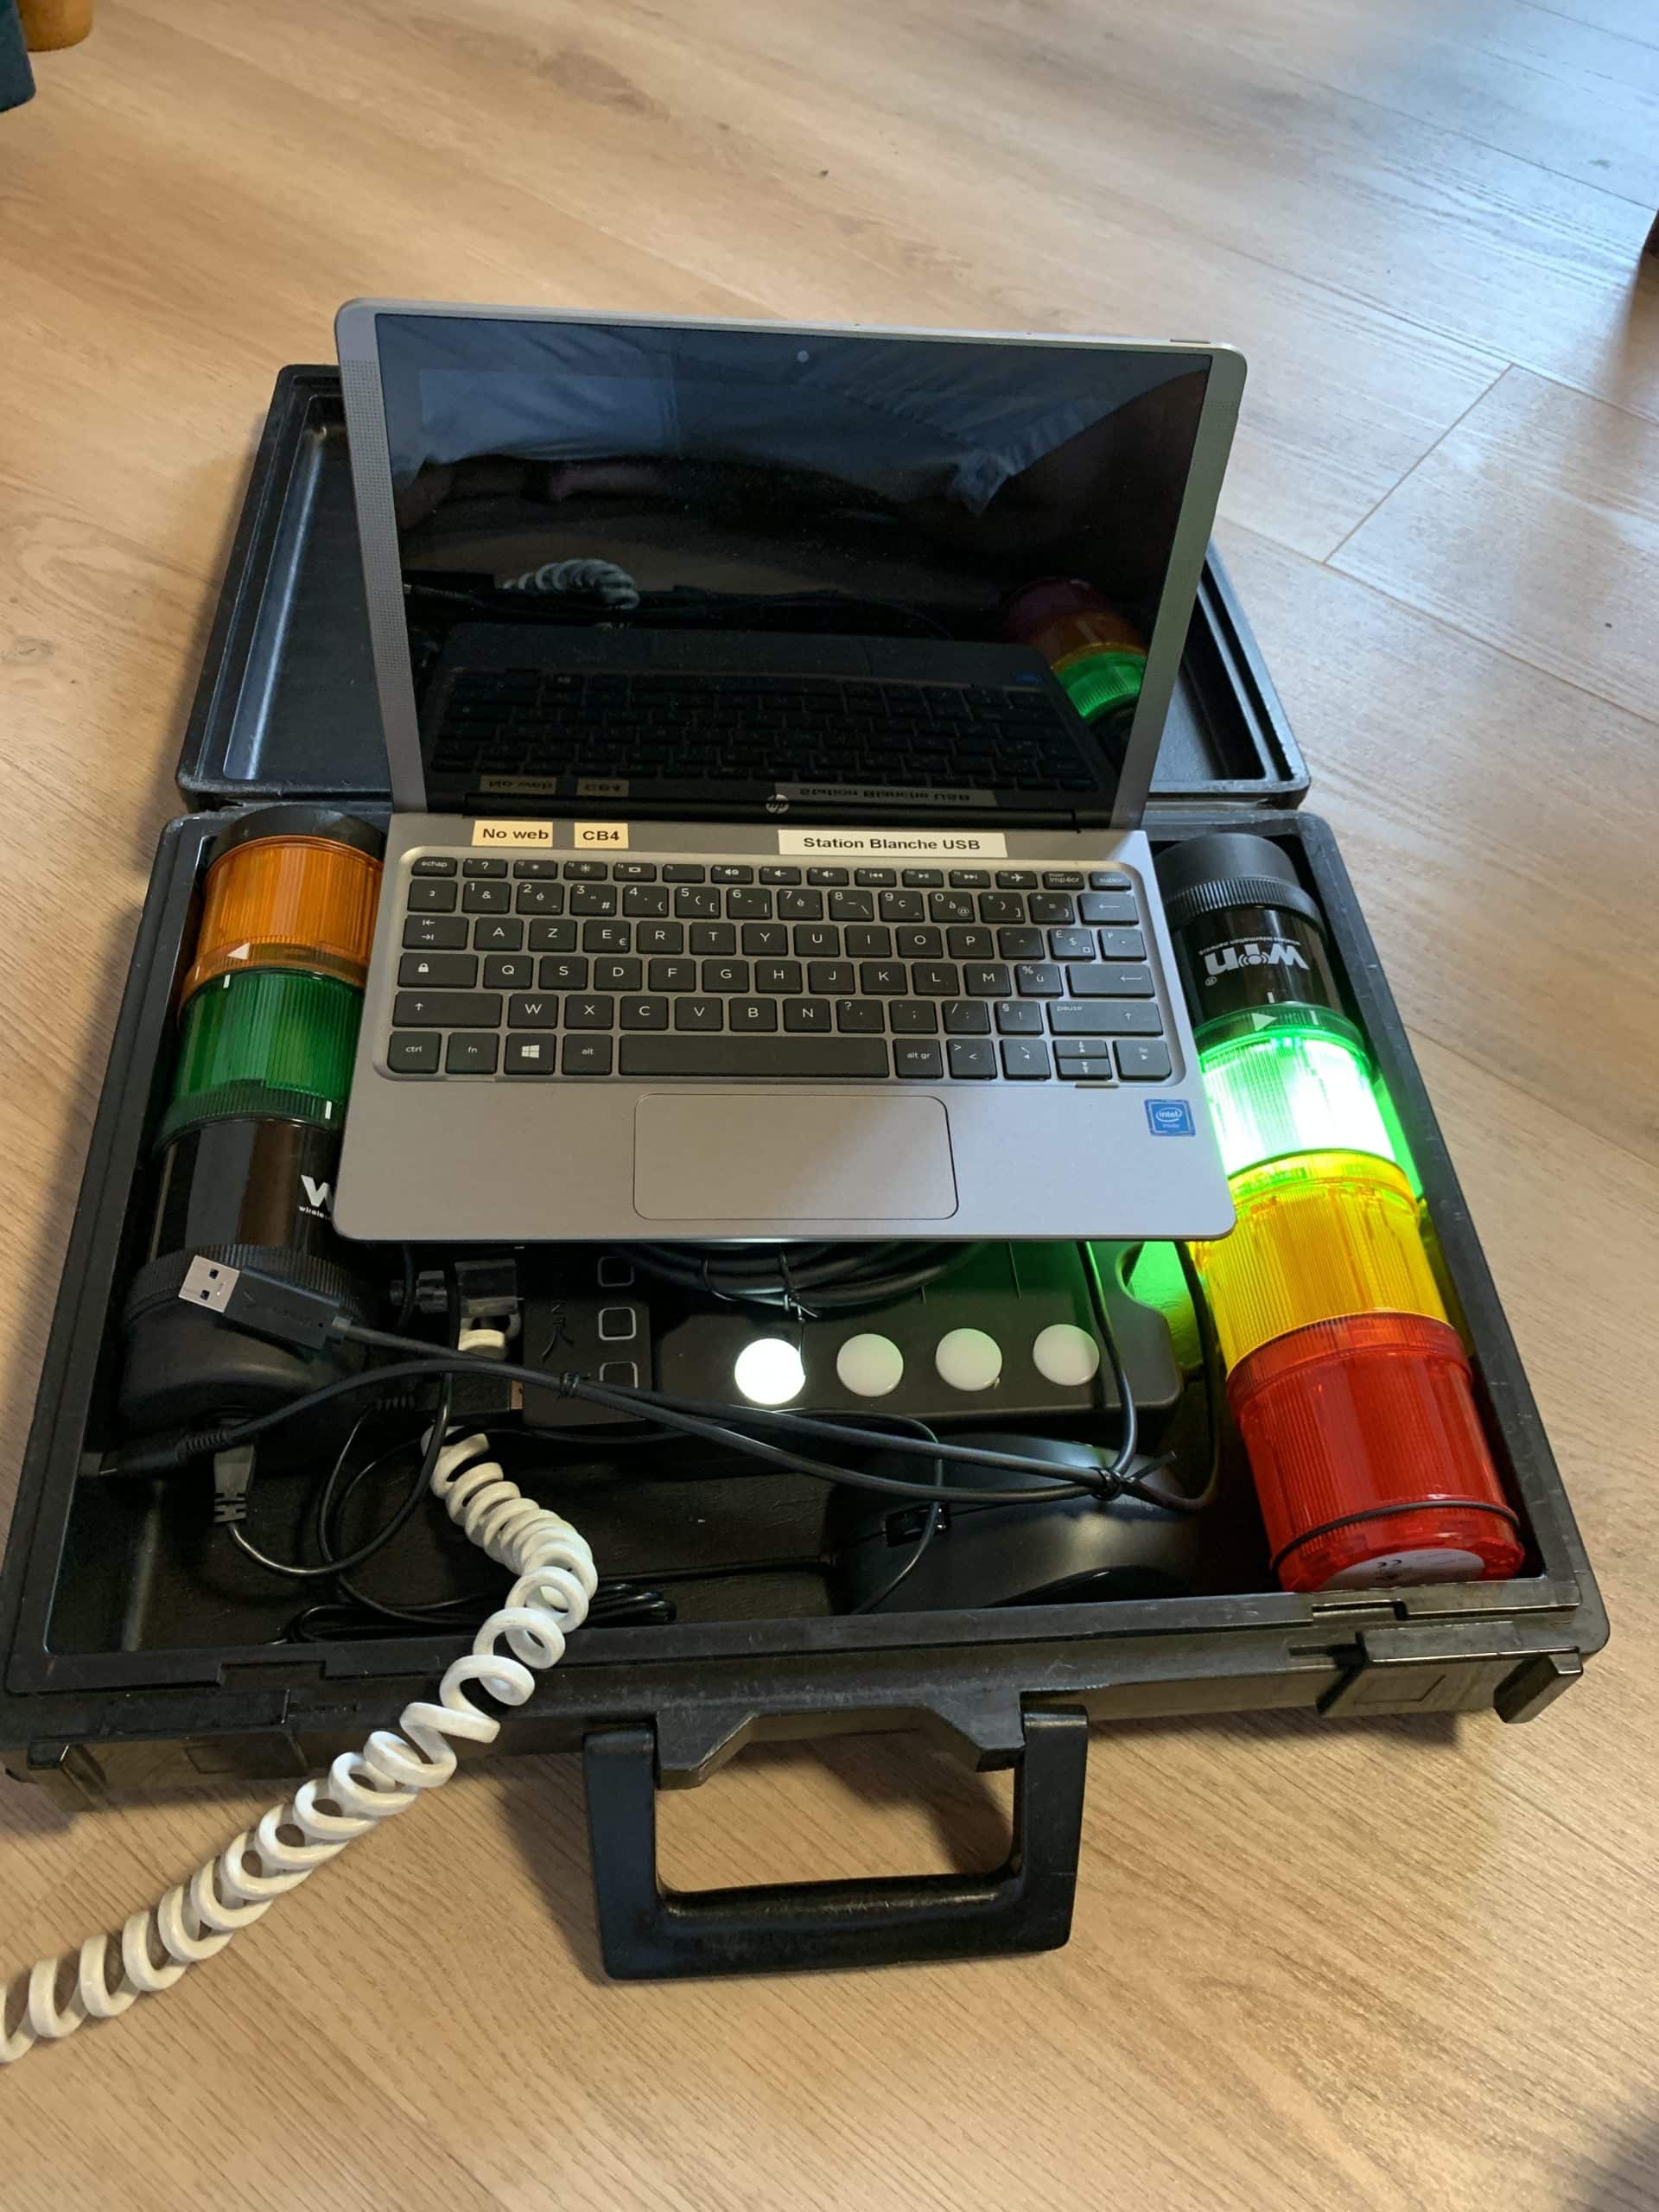
Link Werma Smart Monitor with your data daily routines.
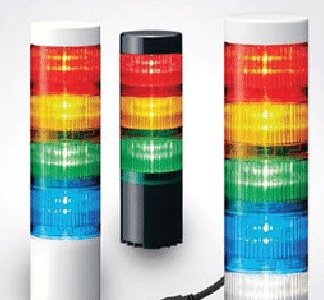
Linking the andon light system with data analysis can provide several benefits in manufacturing and production environments. Some of the potential benefits of this integration include:
- Improved efficiency: By linking the andon light system with data analysis tools, it is possible to quickly identify patterns or trends in problems or issues that arise during the production process. This can help to identify root causes of problems more quickly and implement more effective solutions.
- Enhanced communication: Data analysis tools can provide additional information about problems or issues signaled by the andon light system, helping to facilitate better communication and understanding among team members and supervisors.
- Improved decision-making: By linking the andon light system with data analysis tools, it is possible to gather and analyze more data about problems and issues that arise during the production process. This can help managers and supervisors make more informed decisions about how to address problems and improve efficiency.
- Better forecasting: By analyzing data from the andon light system, it is possible to develop more accurate forecasts of future production needs and challenges. This can help to better plan for future production and identify potential problems before they arise.
Overall, linking the andon light system with data analysis can provide valuable insights and improve communication, decision-making, and efficiency in manufacturing and production environments.
how to make quick win with andon light and data?
There are several steps that can be taken to make quick wins with the andon light system and data analysis:
- Identify key areas for improvement: By analyzing data from the andon light system, it is possible to identify areas of the production process that are experiencing the most problems or issues. This can help to focus efforts on the most impactful areas for improvement.
- Analyze root causes: By using data analysis tools to dig deeper into the root causes of problems signaled by the andon light system, it is possible to identify more effective solutions that address the underlying issues.
- Implement quick fixes: By identifying and implementing quick fixes for problems signaled by the andon light system, it is possible to quickly improve efficiency and reduce disruptions to the production process.
- Monitor progress: By tracking progress and collecting data on the effectiveness of quick fixes and other improvements, it is possible to continuously improve and identify areas for further improvement.
Overall, by using the andon light system and data analysis to identify and address problems in the production process, it is possible to make quick wins and improve efficiency in the short-term.
In the fast-paced environment of manufacturing and production, efficiency and rapid response to issues are crucial for success. The Werma Smart Monitor system, an advanced andon light system, serves as a pivotal tool in signaling problems in real time. However, its potential is magnified when linked with data analysis tools. This integration can revolutionize how problems are detected, analyzed, and resolved, leading to significant improvements in various operational facets.
Benefits of Integrating Werma Smart Monitor with Data Analysis
1. Improved Efficiency through Proactive Problem-Solving: Integrating the Werma Smart Monitor with data analysis tools enables a deeper understanding of the production process by highlighting patterns and trends in operational issues. This proactive approach allows for quick identification of the root causes of disruptions, speeding up the resolution process, and reducing downtime. For instance, if a particular workstation consistently signals delays, data analysis can help determine if the issue is due to equipment failure, process inefficiencies, or human error, leading to targeted and effective solutions.
2. Enhanced Communication Across Teams: The andon system is traditionally used to alert about production line issues, but when combined with data analysis, it provides a richer, data-driven context to these alerts. This enriched information fosters better communication among team members and supervisors, ensuring everyone understands not just what the problem is, but why it’s occurring. Enhanced transparency and information sharing facilitate more coordinated efforts to tackle issues and streamline processes.
3. Data-Driven Decision Making: With the integration of data analytics, every alert by the andon light system can be recorded, analyzed, and tracked over time. This accumulation of data provides a wealth of information for managers and supervisors, aiding in more informed decision-making. Managers can see beyond the immediate problems and understand larger patterns affecting production, which can influence strategic decisions such as adjustments in workflow, shifts in resource allocation, or investments in new technologies.
4. Improved Forecasting for Future Production Needs: Data collected from the Werma Smart Monitor can be analyzed to predict future trends and potential bottlenecks in the production process. This predictive capability allows for better preparation and resource planning, minimizing the risk of future disruptions. For example, if data shows that a particular component frequently causes slowdowns, proactive measures such as pre-stocking this component or scheduling regular maintenance checks can be implemented.
Implementing Quick Wins with Werma Smart Monitor and Data Analysis
Step 1: Identify Key Improvement Areas Begin by collecting and analyzing data from the Werma Smart Monitor to identify which parts of the production process are most prone to issues. Focusing on these areas will yield the most significant impact on overall efficiency.
Step 2: Analyze Root Causes Use advanced data analysis tools to drill down into the specific causes of alerts. Understanding whether issues are caused by machine failure, supply chain delays, or human factors can help tailor more effective solutions.
Step 3: Implement Quick Fixes Based on the analysis, implement quick fixes that can address the most pressing issues. Even simple adjustments, like recalibrating a machine or retraining staff on certain procedures, can have immediate benefits in reducing stoppages and improving output quality.
Step 4: Monitor Progress and Optimize After implementing changes, continue to monitor the system and the data it generates. This ongoing analysis will not only show whether the fixes are working but also highlight new areas for improvement. It establishes a continuous improvement cycle that keeps the production process lean and competitive.


